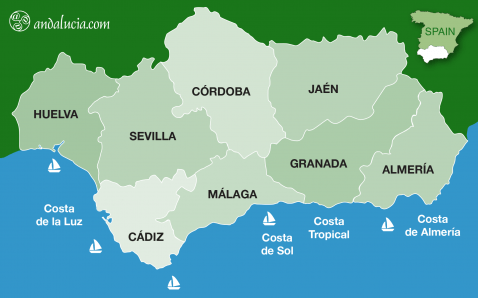
Map of Andalucia showing 8 provinces |
|
ANDALUCIA - GDP
The GDP (PIB Producto Interior Bruto in Spanish) is a measure of the total market value of all the goods and services produced by a country in a given period. GDP is widely used by economists to gauge the health of an economy, as its variations are relatively quickly identified. However, its value as an indicator for the standard of living is considered to be limited. For more explanation of GDP consult Wikipedia.
The 2019 GDP of Andalucia is about 170 thousand million euro which is about 19.600 euro per capita. Compare to EU countries.
Below we reproduce the growth in GDP of Andalucia since its creation as an economic area. In the table below covering 1980-1996 the figures are GVA Gross Value added. (VAB Valor Añadido Bruto in Spanish) It is an older measure and has a the relation GVA + taxes on products - subsidies on products = GDP.
The table below shows the inter-annual growth of GDP for Andalucia. We highlight six distinct phases:
- “Early Development” from 1980 to 1991 with an average inter annual growth of 12.9 %
- “Downturn” from 1992 to 1997 with an average inter-annual growth of 5.8 %.
- “Property Boom” from 1998 to 2006 with an average inter-annual growth of 7.5 %.
- “Crisis” from 2008 to 2013 and continuing with an average inter-annual growth of -1.0%.
- "Recovery" from 2014 to 2019 and continuing with an average inter-annual growth 2.5%
- "Coronavirus" 2020 and 2021
| GVA ‘000 euro | Variation Inter-Annual | |
|---|---|---|
| 1980 | 11.150.518 | - |
| 1981 | 12.457.274 | 11,7 % |
| 1982 | 14.495.071 | 16,4 % |
| 1983 | 16.638.571 | 14,8 % |
| 1984 | 18.742.839 | 12,6 % |
| 1985 | 21.333.286 | 13,8 % |
| 1986 | 24.187.762 | 13,4 % |
| 1987 | 27.073.476 | 11,9 % |
| 1988 | 29.869.815 | 10,3 % |
| 1989 | 33.098.238 | 10,8 % |
| 1990 | 38.344.677 | 15,9 % |
| 1991 | 42.210.321 | 10,1 % |
| 1992 | 44.546.399 | 5,5 % |
| 1993 | 46.068.917 | 3,4 % |
| 1994 | 48.876.458 | 6,1 % |
| 1995 | 51.962.411 | 6,3 % |
| 1996 | 54.785.351 | 5,4 % |
Source: Contabilidad Regional de Andalucía Instituto de Estadistica y Cartografia de Andalucia.
From 1996 onwards we present the actual GDP and its inter annual variation.
| GVA ‘000 euro | Variation Inter-Annual | |
|---|---|---|
| 1995 | 59.051.045 | - |
| 1996 | 62.853.140 | 6,6 % |
| 1997 | 67.267.844 | 7,0 % |
| 1998 | 72.440.475 | 7,7 % |
| 1999 | 78.750.075 | 8,7 % |
| 2000 | 86.215.965 | 9,5 % |
| 2001 | 93.066.604 | 7,9 % |
| 2002 | 100.155.249 | 7,6 % |
| 2003 | 108.728.806 | 8,6 % |
| 2004 | 117.443.935 | 8,0 % |
| 2005 | 127.097.905 | 8,2 % |
| 2006 | 137.942.742 | 8,5 % |
| 2007 | 147.616.662 | 3,6 % |
| 2008 | 151.844.357 | 0,6 % |
| 2009 | 146.622.148 | -3,6 % |
| 2010 | -1,1 % | |
| 2011 | 149,163,807 | -1,2 % |
| 2012 | -3,1 % | |
| 2013 | -1,6 % | |
| 2014 | 1,4 % | |
| 2015 | 3,6 % | |
| 2016 | 2,6 % | |
| 2017 | -3,0 % | |
| 2018 | 2,4 % | |
| 2019 | -2,1 % | |
| 2020 | Estimate | -9,0 % |
Sources: INE - Estadisticas territoriales
Instituto de Estadistica y Cartografia de Andaluciaa>
Analistas Económicos de Andalucía" was UNICAJA Analysis Economica de Andalucia.
Book your stay in Andalucia Now!